Create custom metric
CloudWatch metric provides several metrics for Lambda functions such as:
- The number of times the function is executed
- The execution time of each time, error rates
- Throttle count.
We will create a new metric that sums up the number of hits to DynamoDB that fail
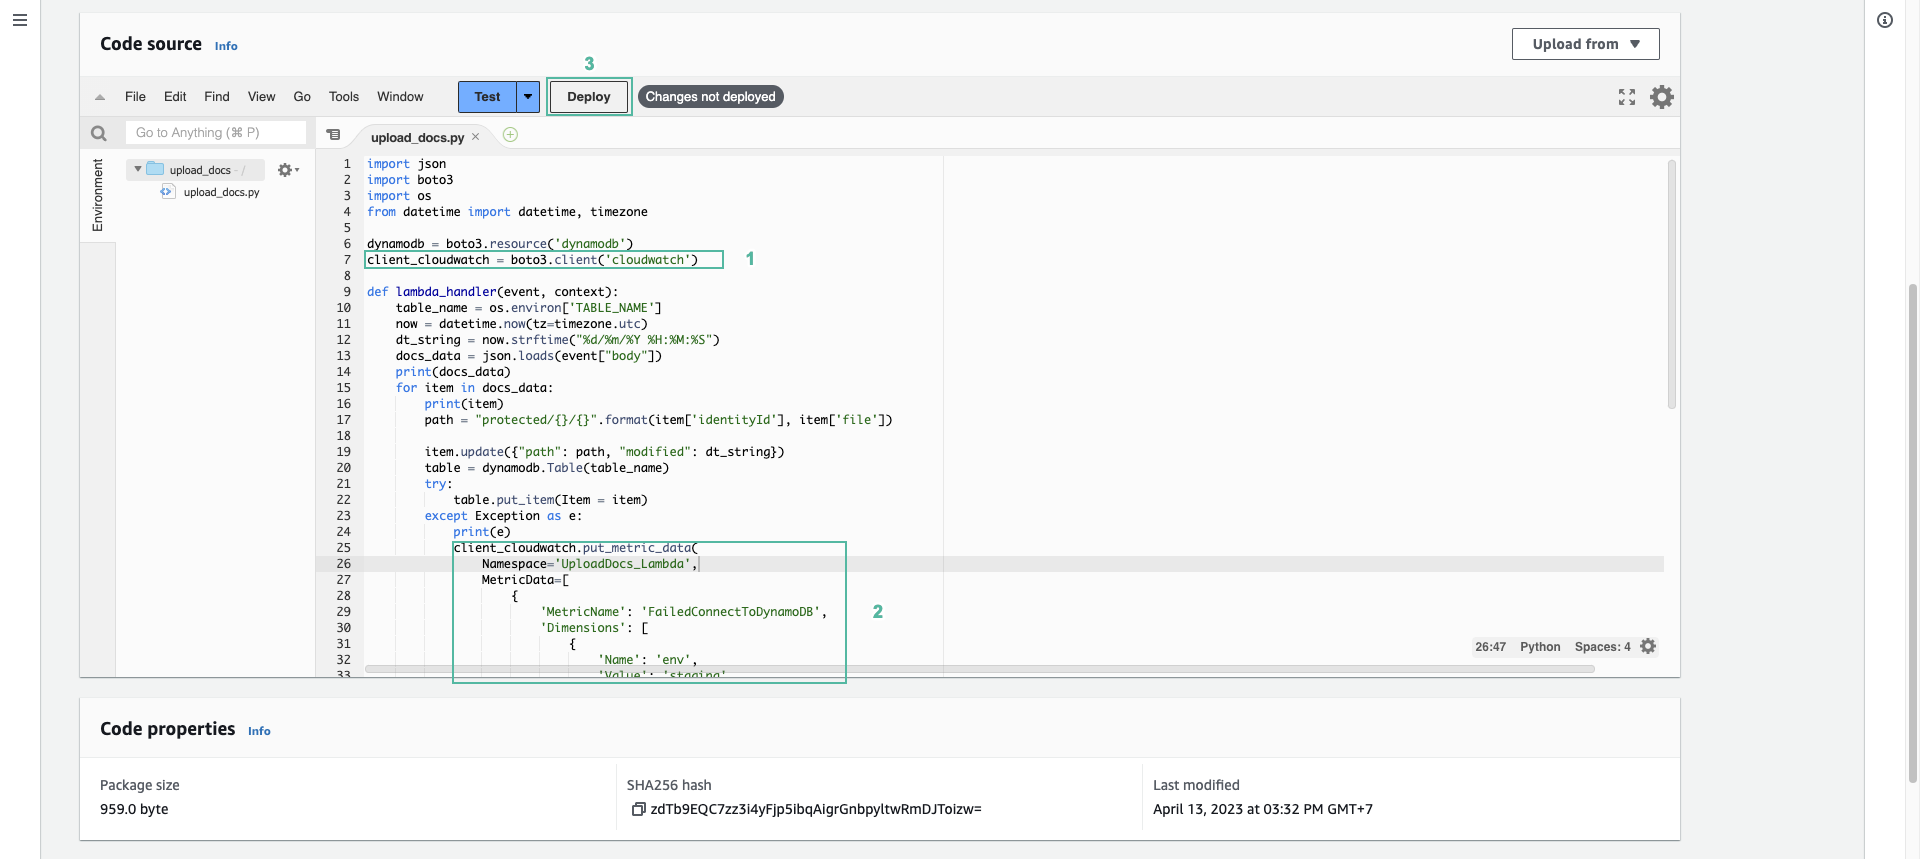
- In the upload_docs function console, select Codetab and add the following line of code at the top of the function
client_cloudwatch = boto3.client('cloudwatch')
- Add the following code to the except block of put_item to DynamoDB table before returning results
        client_cloudwatch.put_metric_data(
            Namespace='BooksList_Lambda',
            MetricData=[
                {
                    'MetricName': 'FailedConnectToDynamoDB',
                    'Dimensions': [
                        {
                            'Name': 'env',
                            'Value': 'staging'
                        },
                    ],
                    'Value': 1.0,
                    'Unit': 'Seconds'
                },
            ]
        )
- The code helps you to create a new metric and push the data into it every time the connection to DynamoDB fails
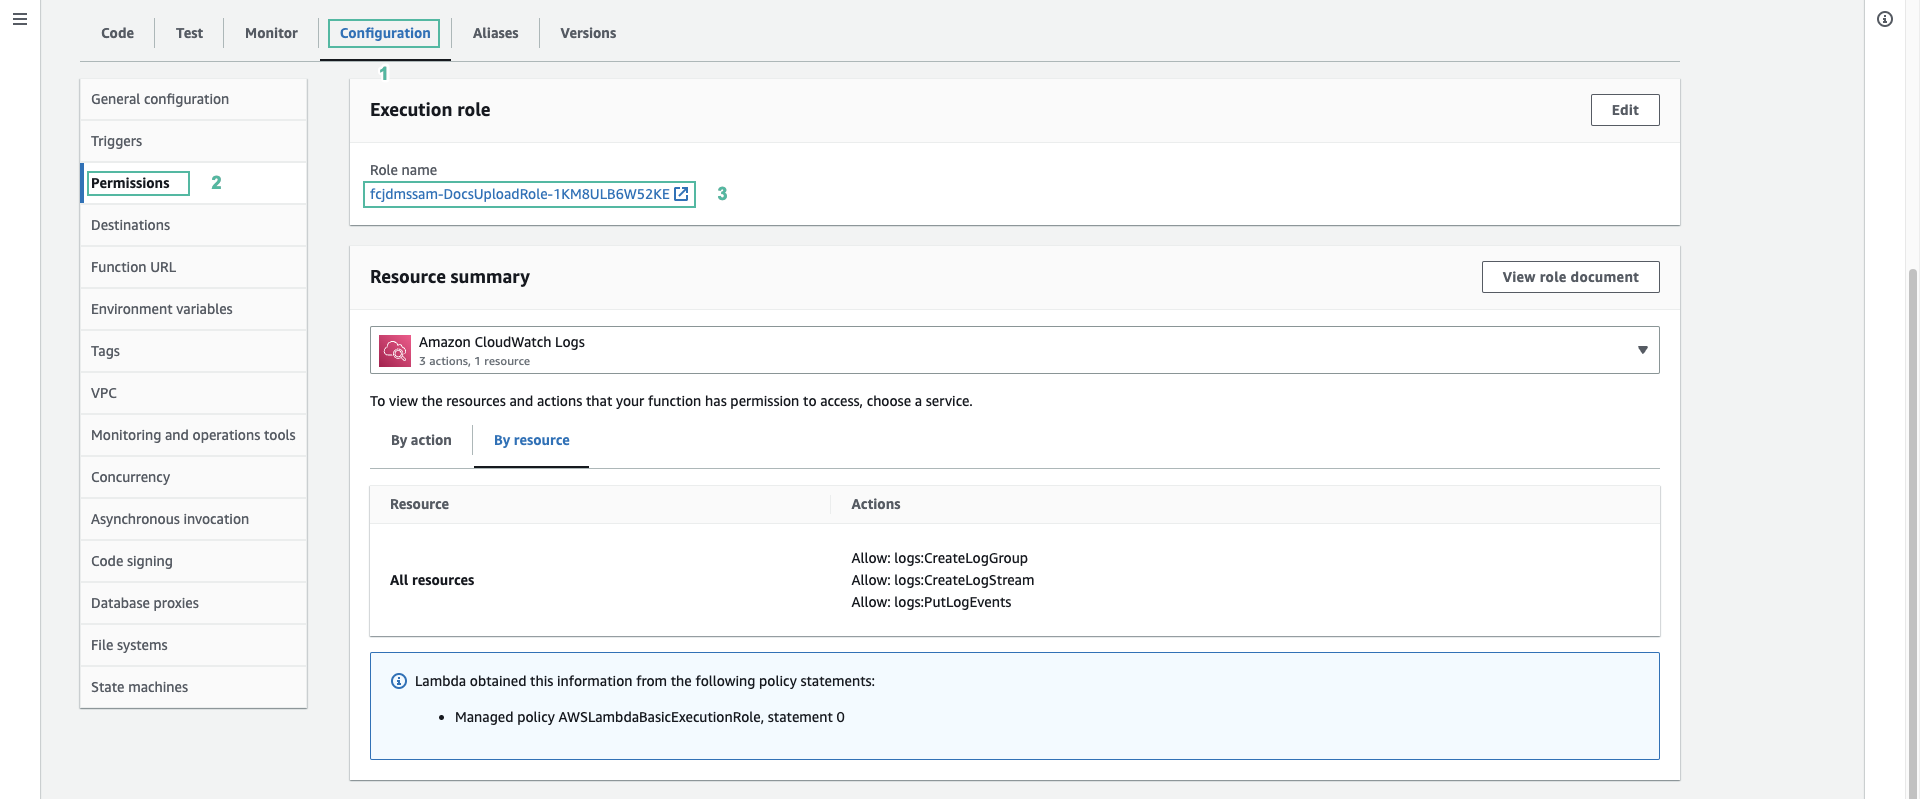
- Give the function permission to access and push data into metric - Select Configure tab and select Permissions on the left menu. - Select the execution role
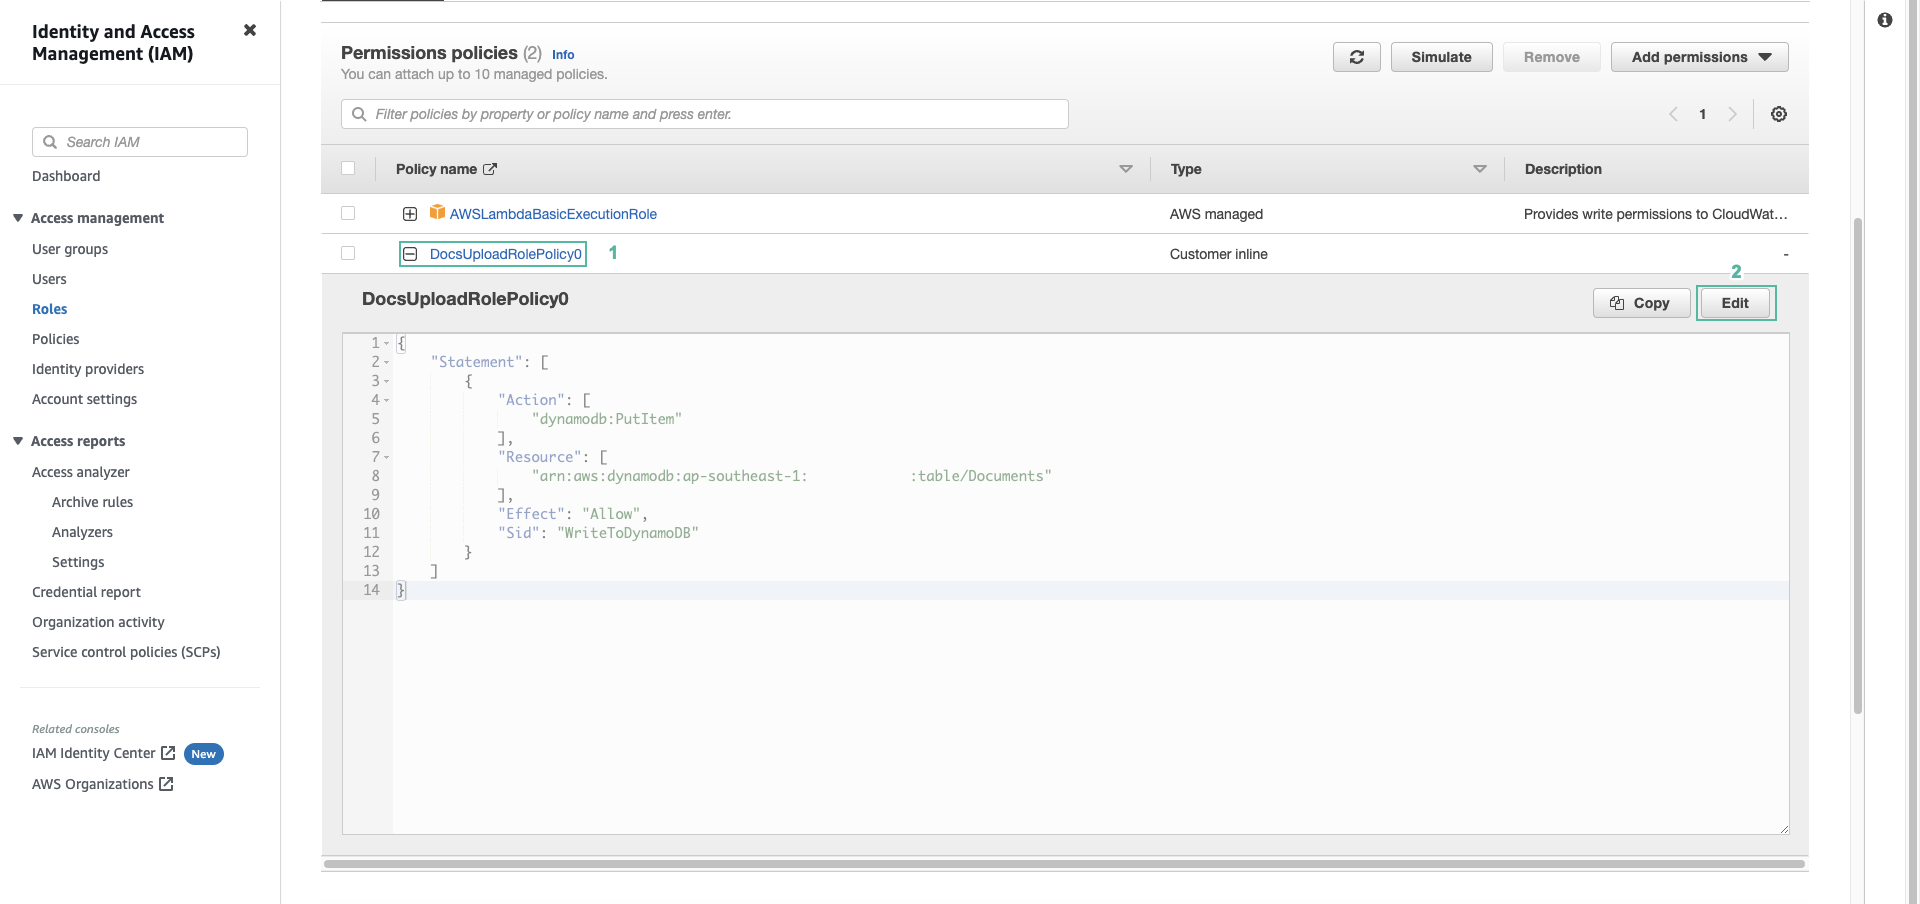
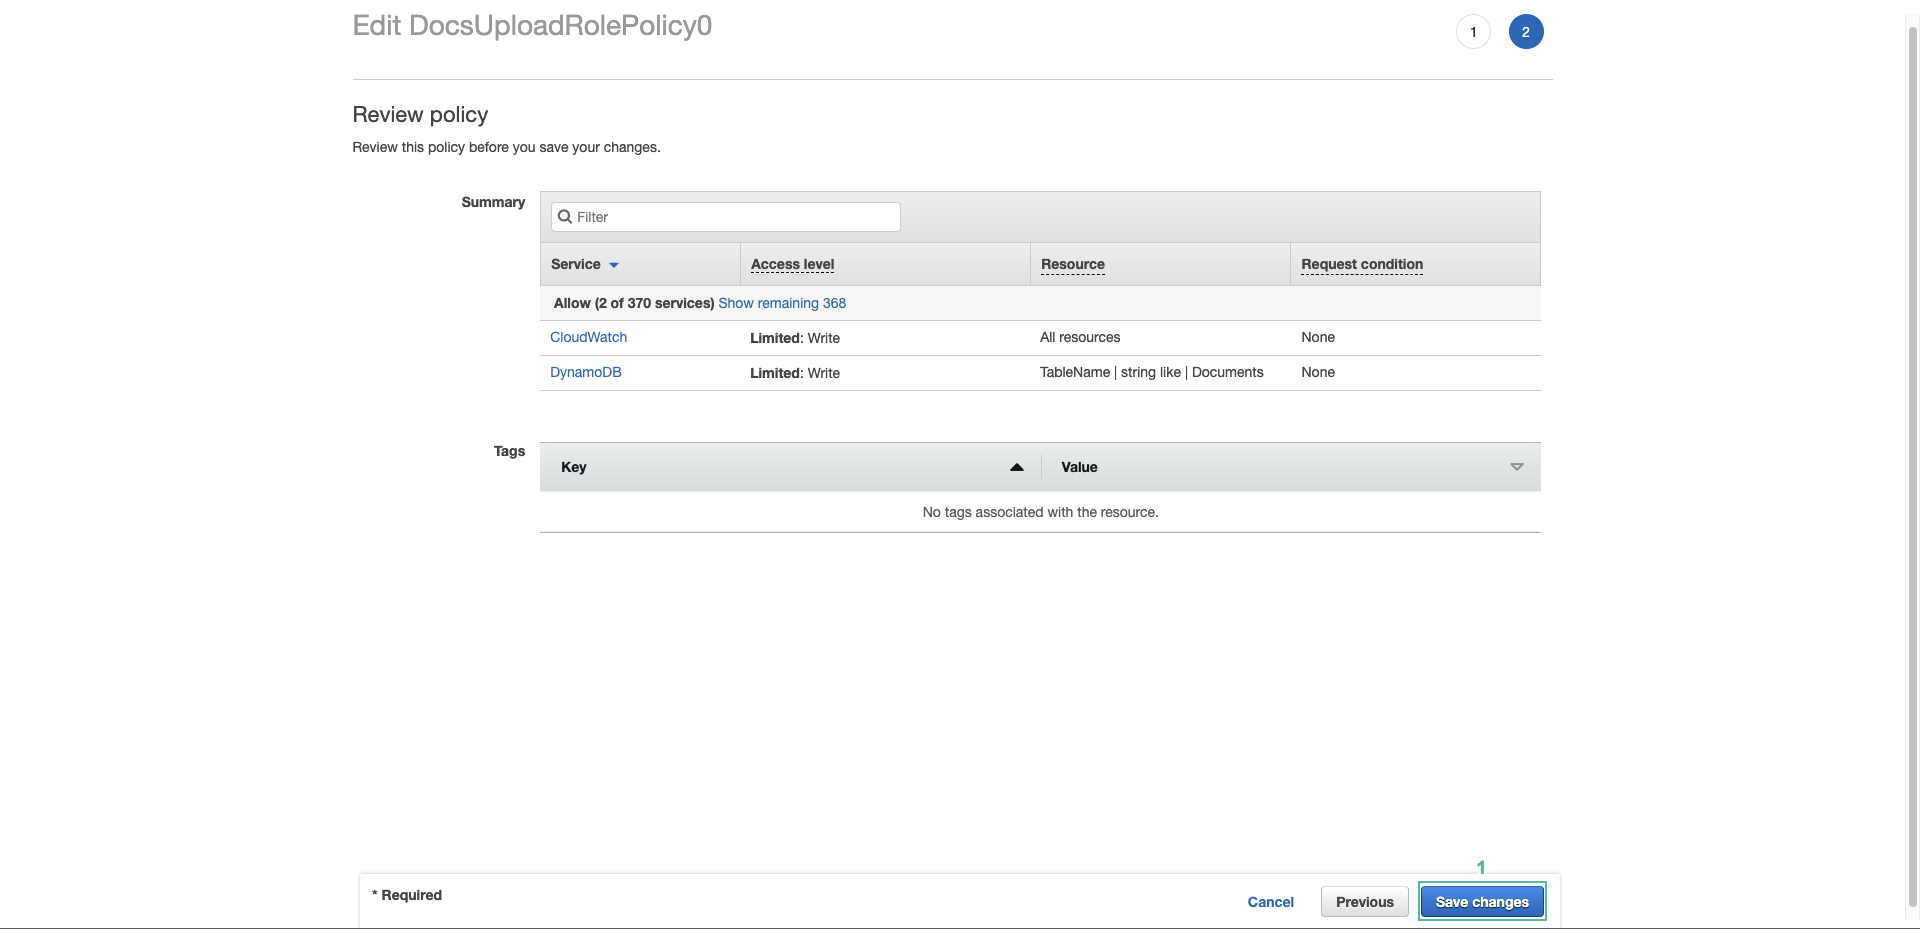
- Expand the policy, then click Edit
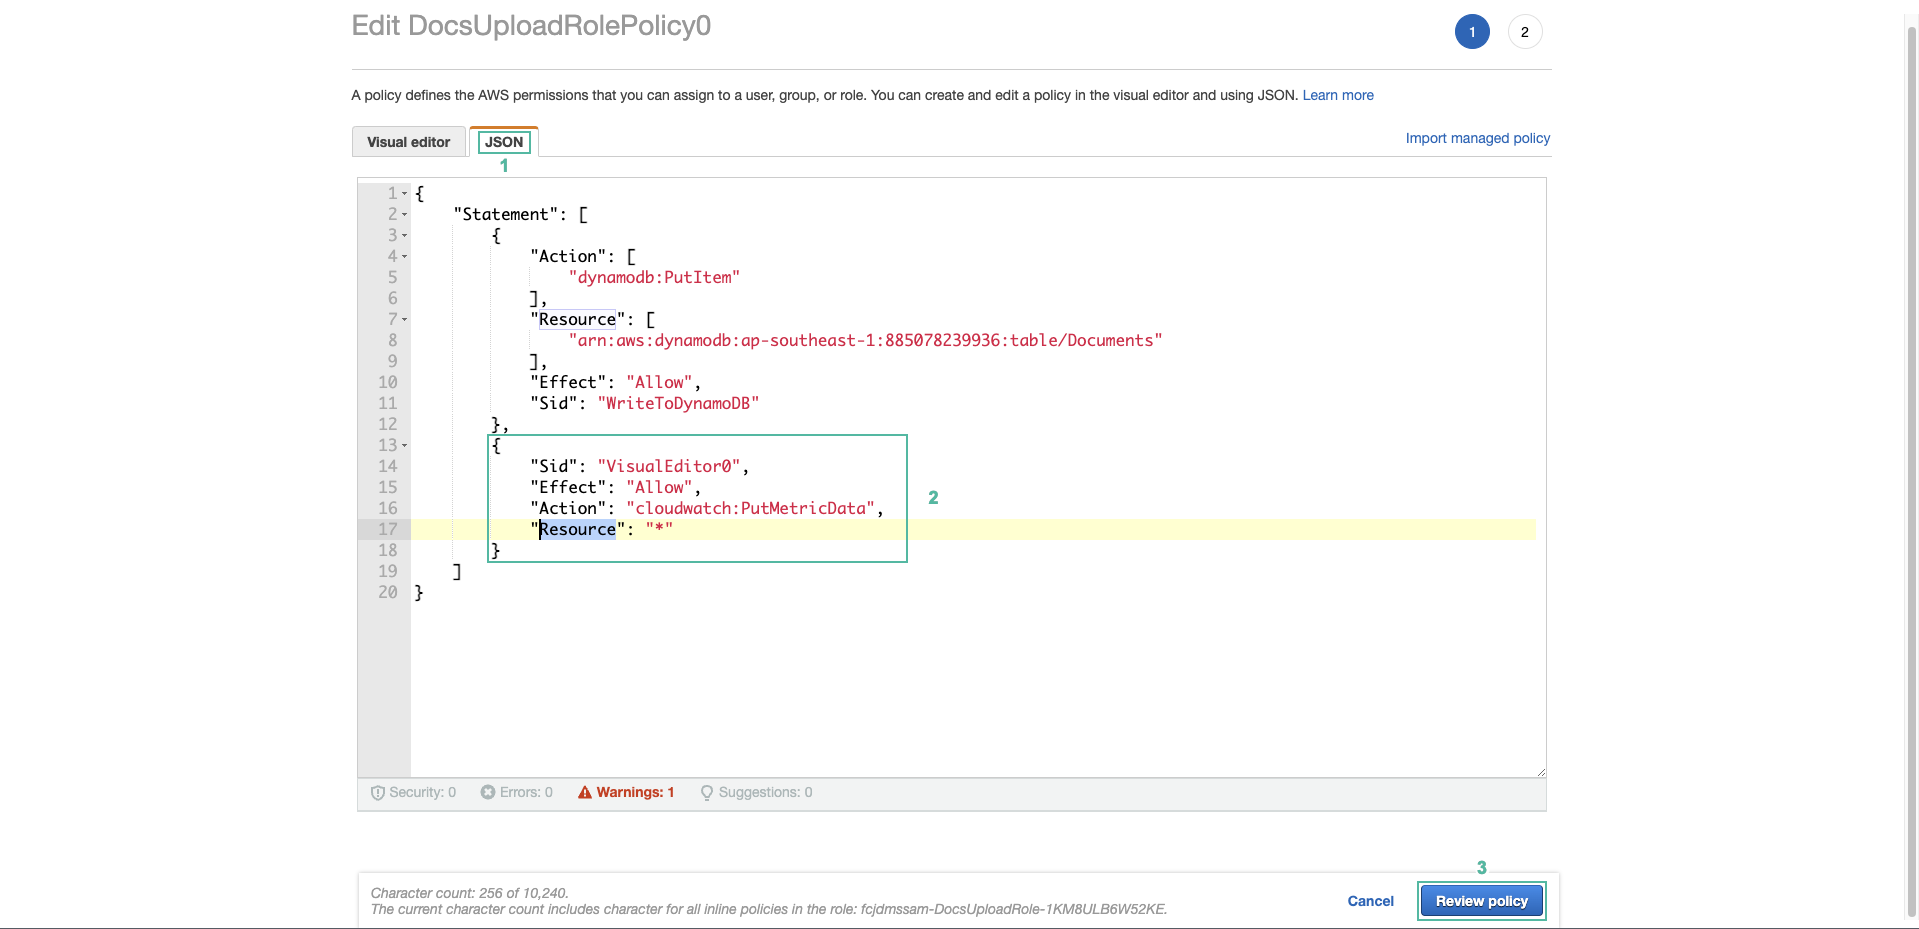
- Add the following to the JSON tab and click Review policy
{
    "Sid": "VisualEditor0",
    "Effect": "Allow",
    "Action": "cloudwatch:PutMetricData",
    "Resourse": "*"
},
- Click Save changes
- Test POST API again with API Gateway
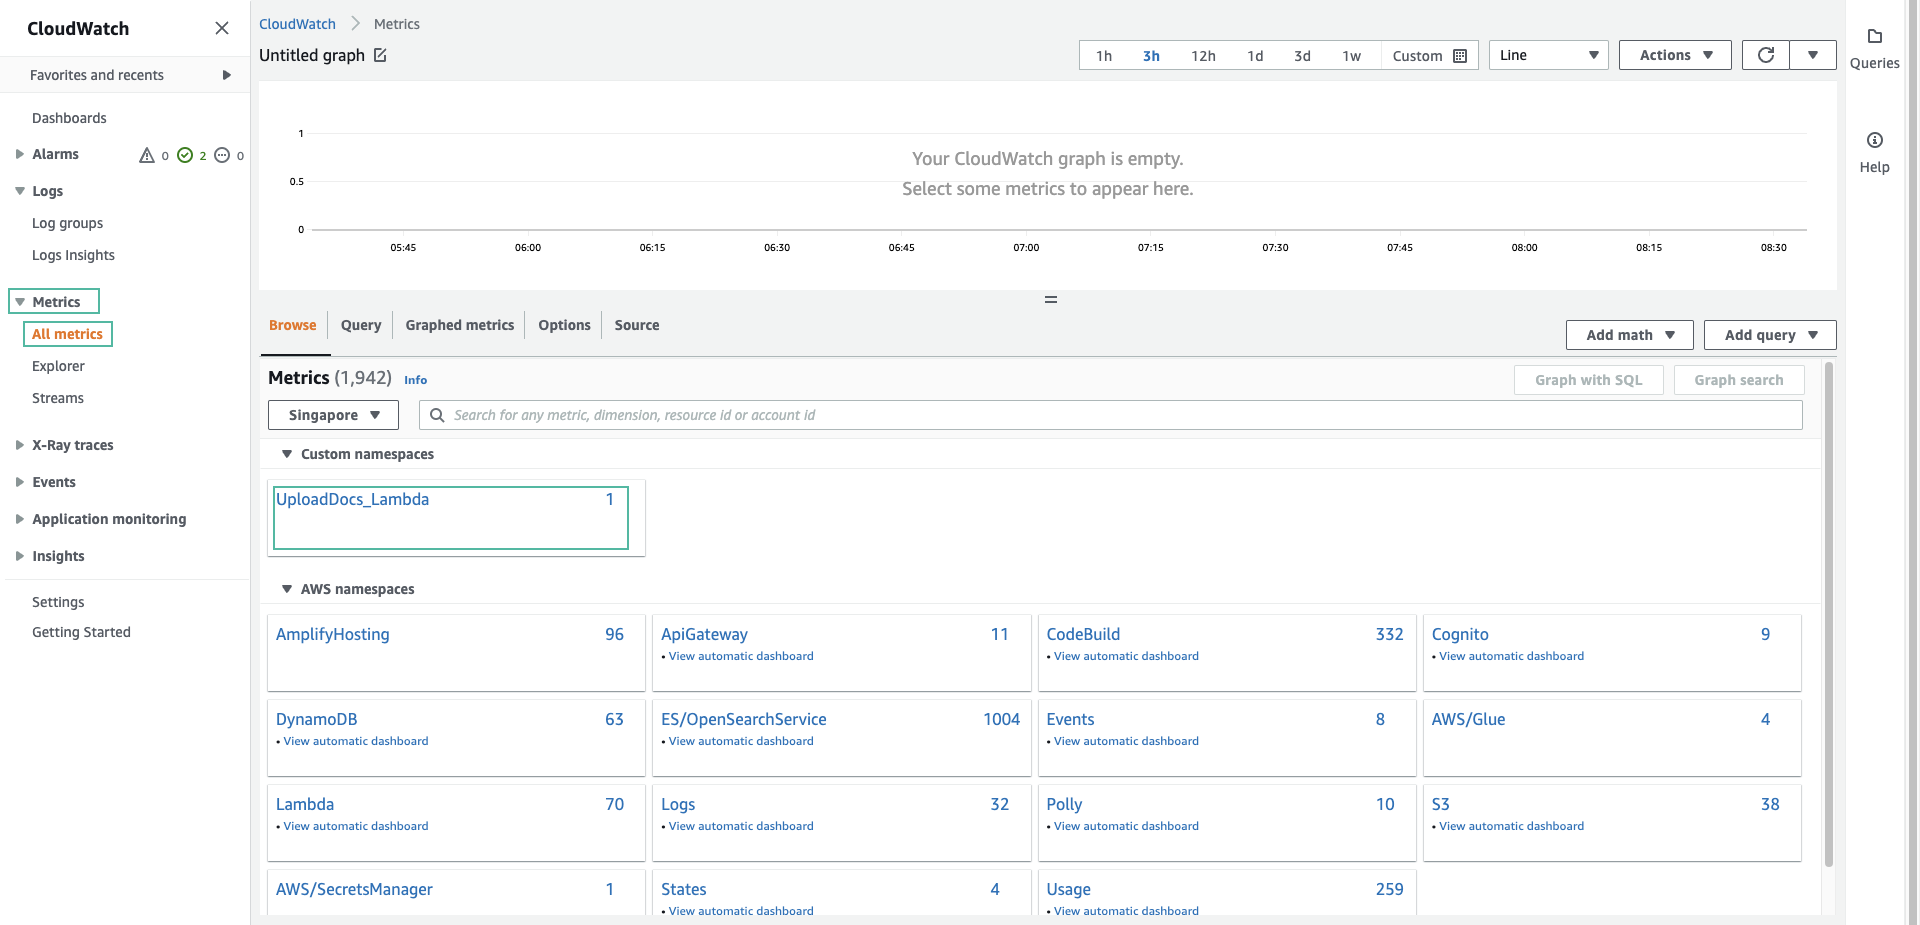
- Open the CloudWatch dashboard
- Click on Metrics in the left menu, then click All metrics
- In the Custom namespaces section appears the metric you created - UploadDocs_Lambda. Click it
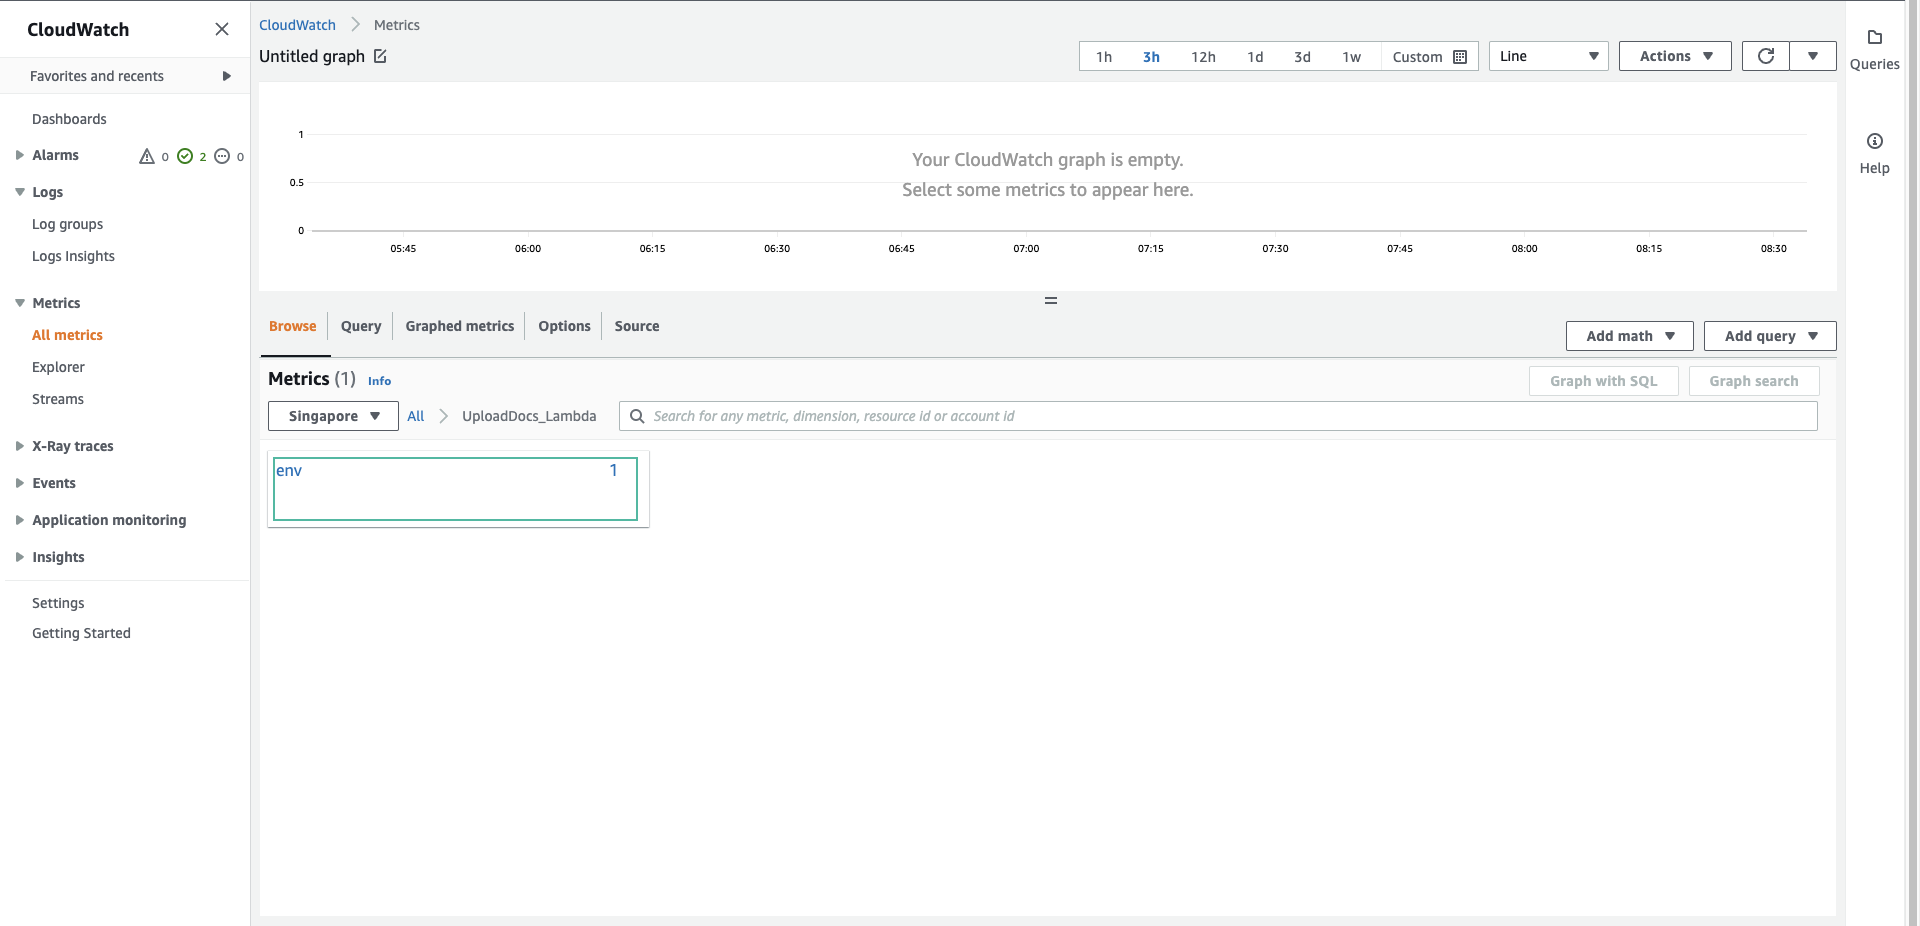
- Click env
- Select staging, data display chart
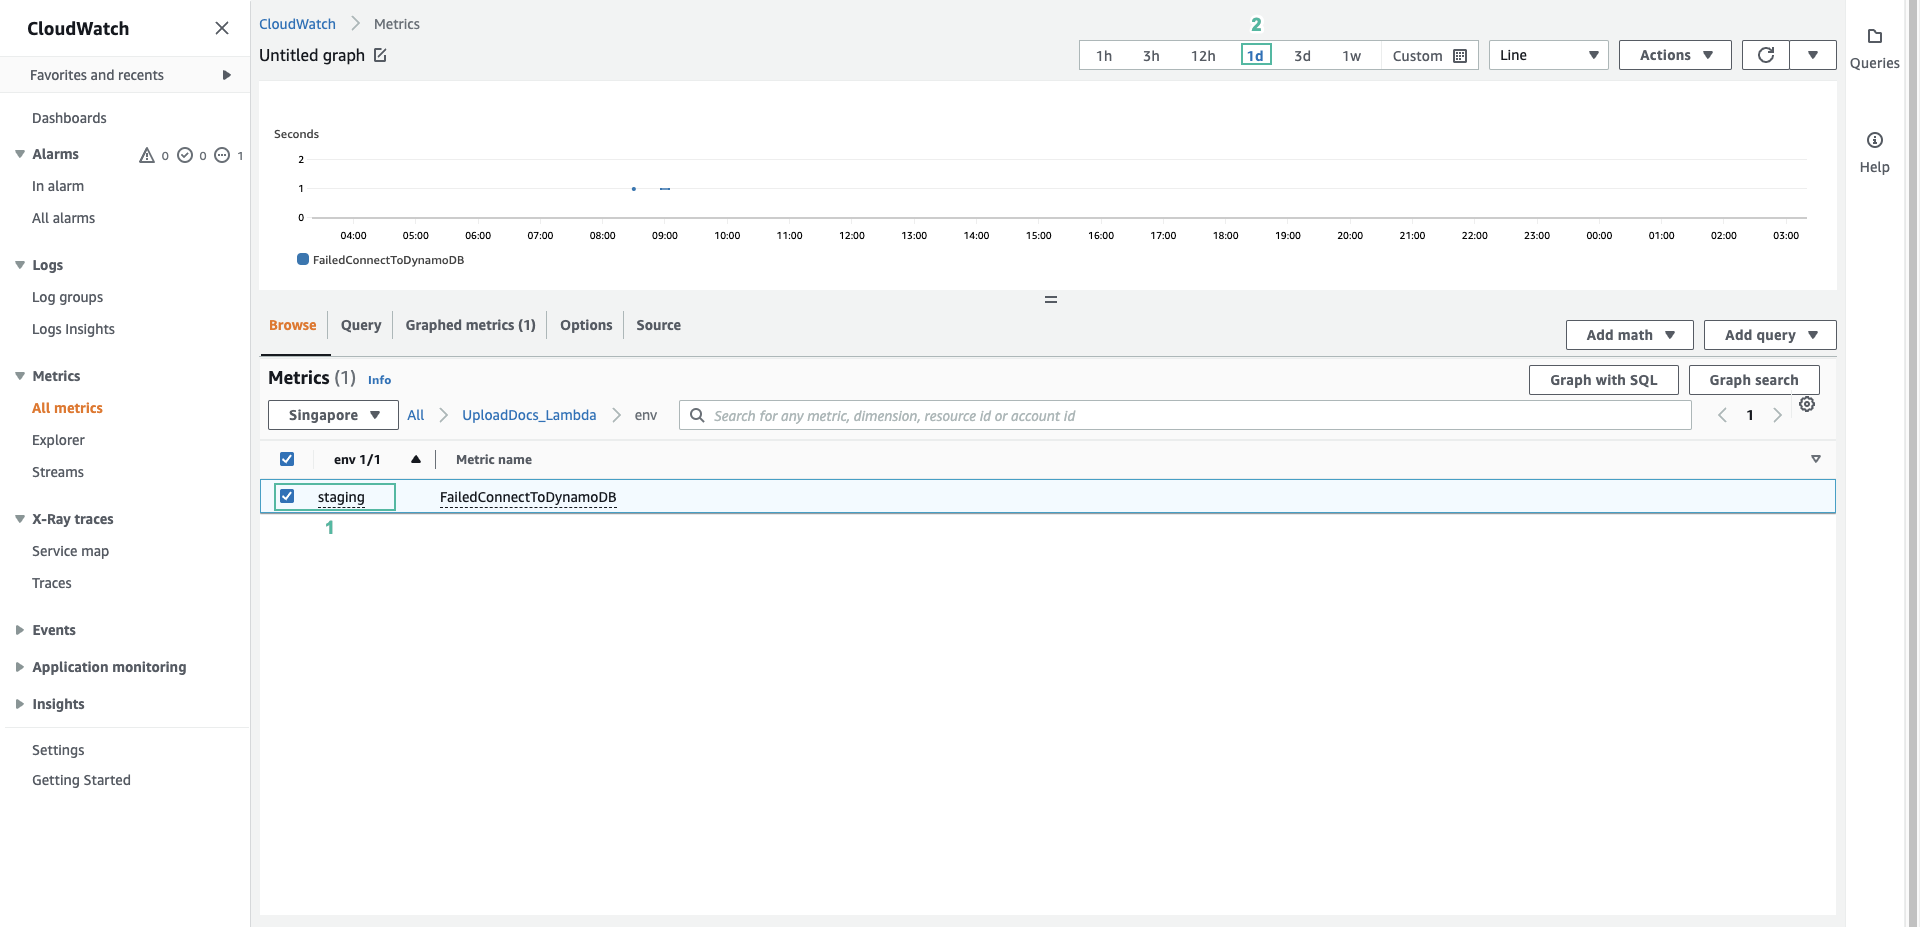
- You can choose to display parameters according to 1 day or 1 week time, line or number displayed at the top of the graph.
So we have created a custom metric. Next step we will use it to create a CloudWatch Alarm